Mixed signal.
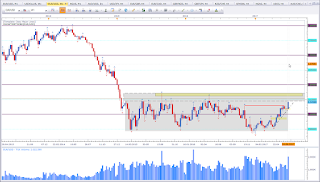
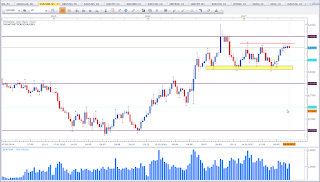
This is the weekly chart of EUR vs USD. Price is aproaching the range resistance level. This catches my attention. We may see a signal with next week close. Since 2015 price was only twice able to move above 1,15. We may now see the third attempt.
GBP vs CAD
Mixed signal.
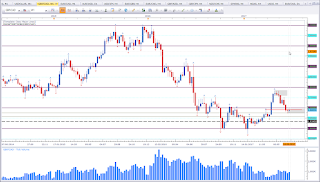
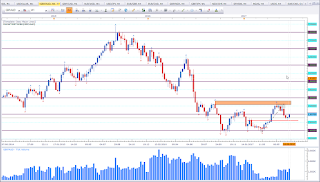
This is the weekly chart of GBP vs CAD. Price is at an interesting level. Last week closed as an Indecisin Candle inside an Indecision Candle. This shows there is support at current levels. The weekly close might confirm the support and give us a bullish setup next week.
AUD vs NZD
Bullish bias for the week.
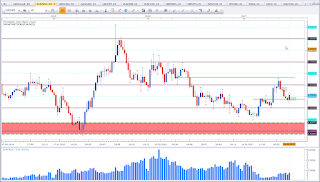
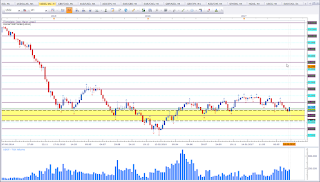
This is the weekly chart of AUD vs NZD. I was talking about this level already in mid June (here). Support held true. Last week closed as a Piercing Pattern, which is a bullish reversal pattern. This puts my bias in favour of the bulls, even though I'd have favoured a close above 1,05. But we have a bullish setup at support. So I will ignore short opportunities and keep an eye for long opportunities.
EUR vs NZD
Bullish bias for the week.
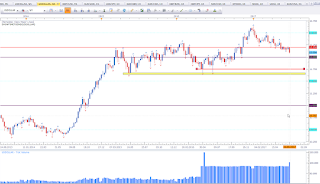
This is the weekly chart of EUR vs NZD. We have a Bullish Engulfing Pattern at support. While this is not an ideal Bullish Engulfing Pattern, the engulfing candle is also an Outside Bar/Candle. A solid bullish candle has the close near the high which would be a preferable setup. But the setup is valid as it is at a significant level. I did highlight this level already two weeks ago (here). This level proved to be significant and we finally did get our signal.
GBP vs USD
Bullish bias for the week.
This is the weekly chart of GBP vs USD. I saw the possible long setup last week, but I was not too keen on looking to go long GBP vs USD cause USDOLLAR was also suggesting bullisness (see here). But USD failed to prove it's strength and we had a strong run on GBP vs USD and EUR vs USD. If USD fails to gain strength, we will see a continued strong GBP vs USD run and possigly a break of the big range on EUR vs USD. I do have mixed feelings about this asset. Technically we have a bullish trend (higher highs and higher lows). We have a bounce off a previous high. Technically we should see a continuation of this pattern. But the current level is a significant level which needs to get violated. The bias for the week is bullish. But this does not mean I have to take a trade. In doubt, stay out. I will have to evaluate as time the week progresses.
USDOLLAR
Bearish bias for the week.
This is the weekly chart of FXCM USDOLLAR. Last week close did negate the supposed bullish bias I did have up to last week. The close below the prevous two pinbars is a sign of weakness. As long USDOLLAR does not hit support I will have a bullish bias on GBP vs USD and EUR vs USD. The first level I have an eye on is 12. The next support levels are quite some distance away so we may have a nice run on the other assets.
EUR vs JPY
Bullish bias for the week.
This is the weekly chart of EUR vs JPY. Price is making higher highs and higher lows. Last week did break a high with a strong bullish candle. Breaking previous highs, we want to see strong bullish candles. This puts my bias in favour of the bulls which is in line with the current bullish trend.
USD vs JPY
Bullish bais for the week.
This is the weekly chart of USD vs JPY. Price found support at the 110 level and is steady making bullish candles. I am looking for a test of 115 sometime in the future.
GBP vs JPY
Bullish bias for the week.
AUD vs USD
Mixed signal.
This is the weekly chart of AUD vs USD. Price is approaching range resistance. This diminishes the supposed bullish move. There is a trend inside the range. But as long range levels have not been violated, range tactics come to play. Keeping the weak outlook for USDOLLAR on the back of my mind, we may see a break out. But currently range resistance is the first level of interest.
EUR vs GBP
Bearish bias for the week.
This is the weekly chart of EUR vs GBP. My bias remains bearish. Four weeks in a row, price was not able to violate the red line. And the weekly closing price has not moved much. This puts my bias in favour of the bears.
GBP vs AUD
Bullish bias for the week.
This is the weekly chart of GBP vs AUD. Price made a bounce off a support level but failed to close above 1,70. Last week did form a Morning Star Pattern which is a bullish reversal pattern. Even though price failed to close above 1,70 my bias is in favour of the bulls.
US Oil
Bullish bias for the week.
This is the weekly chart of US Oil. Price performed a bounce off the support level. We have a Bullish Engulfing Pattern at Support. This puts my bias in favour of the bulls.
GBP vs NZD
Bullish bias for the week.
This is the weekly chart of GBP vs NZD. Price did retrace to the 1,75 level and formed a Bullish Engulfing Pattern at a level of previous congestion. This puts my bias in favour of the bulls.
Happy trading,
TT





Keine Kommentare:
Kommentar veröffentlichen