Bearish bias for the week.
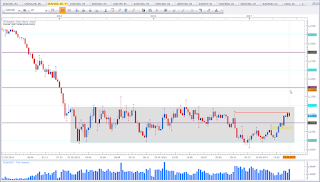
This is EUR vs USD weekly chart. Price formed a Dark Cloud Cover at the red line. This puts my bias in favour of the bears. The chart above clearly illustrates the big range this pair is in. I was expecting a test of range resistance. We still may see the test. But with the bearish formation my bias is bearish for the week. I am expecting a pullback which may test the 1,10 level.
EUR vs CAD
Bearish bias for the week.
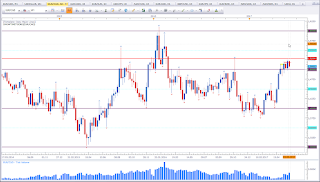
This is EUR vs CAD weekly chart. Price made a stong move up from around 1,40 and is currently showing signs of exhaustion. Last week formed a Dark Cloud Cover at a restistance level. This puts my bias in favour of the bears. I am aware of the support zone around the 1,50 level. Price may range at current levels.
AUD vs CAD
Bullish bias for the week.
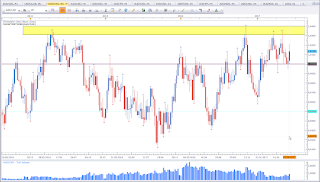
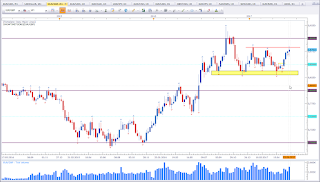
This is AUD vs CAD weekly chart. Price formed a Morning Star Pattern with last week. This puts my bias in favour of the bulls for the week. It seems we may see a test of the yellow zone. There is still enough space to resistance from current levels, so looking for long setups is viable.
CAD vs JPY
Bullish bias for the week.
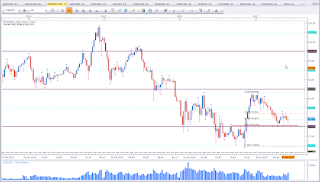
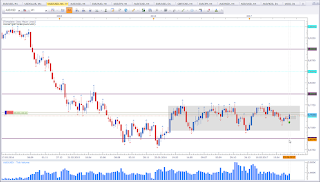
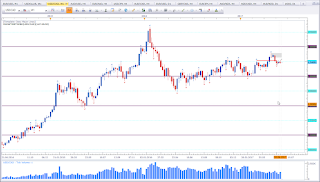
This is CAD vs JPY weekly chart. Price is in a small range and formed a Pinbar. Unfortunately the Pinbar did not form at range support, but touched the support level with the wick. This makes the pinbar less favourable. It confirms there is support at lover levels. The 90 is a key level. Above 90 I am bullish.
GBP vs CAD
Bearish bias for the week.
This is GBP vs CAD weekly chart. The parliamentary elections devalued the GBP pretty strong. Last week formed a Bearish Outside Bar/Candle. This is a bearish continuation pattern. This formation puts my bias in favour of the bears. However, be aware of support at the 1,70 level. We may see a test of 1,70. A close below will add more bearishness.
AUD vs NZD
Mixed signal.
This is AUD vs NZD weekly chart. Price is at an interesting level. Basically I am bearish below 1,05, however price is right on top of support. Last week candle did close as an Inverted Hammer. The issue I have with this candle is, it may also be a rejection candle of 1,05 as that level was significant in the past. Only the weekly close will cofirm the bulls or bears. I am inclined to treat last week candle as a bullish candle, as price is right at support.
Gold
This is Gold weekly chart. I have recently put Gold and Silver on my watch list. Price has all signs of a bullish trend with higher highs and higher lows. The last attempt to form a higher high however failed. Last week closed as a Rejection Candle which engulfs the previous bull candle. This puts my bias in favour of the bears.
GBP vs USD
Mixed signal.
This is GBP vs USD weekly chart. Price formed a Bearish Outside Candle. This is a bearish continuation siganal. Base on this signal I am bearish. However, price closed right on top of support, which diminishes the bearishness and makes me want to see more bearish signs. If I needed to take a short trade, I would opt for EUR vs USD. That pair seems the better candidate for shorts.
Silver
Bearish bias for the week.
This is Silver weekly chart. Last week close confirms the Hanging Man (previous candle) and forms at the same time a Bearish Engulfing Pattern. I would have preferred a close below the wick of the Hanging Man, but we do not always get what we want.
EUR vs JPY
Mixed signal.
This is EUR vs JPY weekly chart. Price is makeing higher highs, but shows struggle to push above 125. Price made about 1.000 Pips with three candles and seems to have run out of steam. The bearish close last week puts my bias in favour of the bears. Being at support it seems we may see price ranging at this level to resume some energy. Last week formed a Bearish Engulfing Pattern, which puts my bias in favour of the bears, but I am ready to go both ways, as price is at support.
USD vs JPY
Bullish bias for the week.
This is USD vs JPY weekly chart. Price formed a Pinbar at 110 level. This puts my bias in favour of the bulls. I did talk about this asset two weeks ago. See here. Price was not able to close below the Bearish Engulfing Pattern but formed a Pinbar at right at the wick of it.
AUD vs USD
Bullish bias for the week.
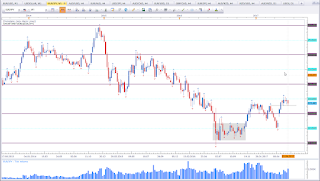
This is AUD vs USD weekly chart. Price is inside a big range. It seemed as if price was forming a bearish trend inside the range indicating a test of range support. However, price was able to close above the 0,75 level and the congestion zone marked with the small rectangel inside the big rectangle, This puts my bias in favour of the bulls.
EUR vs AUD
Bearish bias for the week.
This is EUR vs AUD weekly chart. Price formed a Bearish Engulfing Pattern at a level of interest. This together with the close below 1,50 puts my bias in favour of the bears.
EUR vs GBP
Mixed signal.
This is EUR vs GBP weekly chart. Price formed an Indecision Candle (High Wave Candle) at a level of interest. It is worth to keep an eye on this pair.
USD vs CAD
Mixed signal.
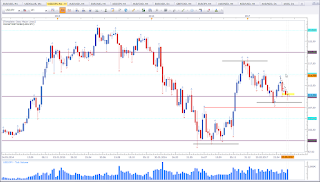
This is USD vs CAD weekly chart. Bascally I am bearish below 1,35. But price is in a congestion zone. This puts my bias neutral until I see a breakout. Usually a Breakout will lead to a nice move. Price recently broke a resistance level and made a new high. Now price is back at the former resistance level and testing it now as support.
NGAS
Mixed signal.
This is NGAS weekly chart. Price is sitting on top of a support level wich is in confluence with the 3,0 level. It is very worth to keep an eye on this level.
Cross Currency Analysis
The three strong single currencies are USD, AUD, and CAD.
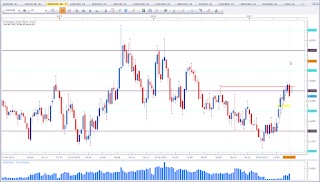
The EUR seems to be the weakest pair throughout the analyzed assets. While I have a rather bearish bias for EUR vs USD my bias is mixed on GBP vs USD. Looking at the USDOLLAR should help making a decision. USDOLLAR formed a Pinbar at support which is a bullish pattern. Putting these three together, I would rather look to short EUR vs USD rather than GBP vs USD.
The USD and AUD are about the strongest currencies. That makes trading AUD vs USD less favourable. But a good pair to trade would be EUR vs AUD.
Among all JPY pairs I favour USD vs JPY the most.
There is so much more to write about, but I think I did cover the most essential ones without making it too complicated. I like my thoughts to be like my charts. Simple and clean.
Thank you for reading. If you have any questions or would like to add your thoughts, please leave them in the comments section below.
Happy trading,
TT



Keine Kommentare:
Kommentar veröffentlichen