EUR vs CAD
Bullish bias for the week.
 |
| EUR vs CAD W1 |
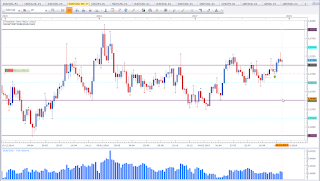
This is the weekly chart of EUR vs CAD. Last week failed to violate the 1,50 level and formed a Rejection Candle. This puts my bias in favour of the bulls.
XAU vs USD
Bearish bias for the week.
 |
| XAU vs USD W1 |
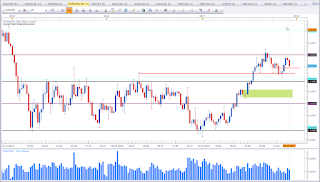
This is the weekly chart of Gold. Price did break the higher low to the downside and made a close below 1.250. This puts my bias in favour of the bears. We have the beginning signs of a trend shift.
USDOLLAR
Bullish bias for the week.
 |
| FXCM USDOLLAR |
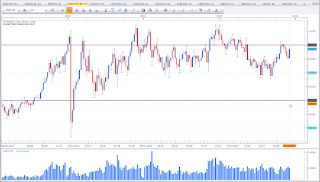
This is the weekly chart of FXCM USDOLLAR. Last week close did complete the Morning Star Pattern. This is a bullish reversal pattern. But what's more important is, the question wheather this asset built a higher low. At the moment it appears like the establishment of a higher low. The close above the 12 level puts my bias in favour of the bulls. I am not trading this asset, but I like to use this asset to establish trading ideas on other assets such as EUR vs USD etc.
EUR vs USD
Mixed signal.
 |
| EUR vs USD W1 |
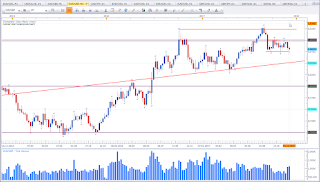
This is the weekly chart of EUR vs USD. This asset is in a bullish trend. Currently we don't know if the pullback is over and we'll see a continuation of the bullish trend. We may also see the beginning signs of a trend shift followed by a deeper correction (or even a trend change). Last week did complete the Evening Star Pattern, which is a bearish reversal pattern. This asset made about 1.500 pips without really a pullback since April this year. With a bullish Dollar bias, chances are in favour of the Evening Star Pattern on this asset. Time will tell. I still would like to see a test of the black horizontal line, ideally of the green rectangle.
Ger30
Bullish bias for the week.
 |
| Ger30 W1 |
This is the weekly chart of Ger30/DAX30. Last week did close as a Bullish Engulfing Pattern at a relevant level. This is not an ideal Bullish Engulfing Pattern is the engulfing pattern failed to close above the previous candle. However, the pattern is valid and it is at a relevant level. We trade what we see. And that is a bullish pattern at a level of interest. Additionally we have a closing price above the 13.000 level. All this puts my bias in favour of the bulls.
Copper
Bearish bias for the week.
 |
| Copper W1 |
This is the weekly chart of Copper. This asset is in a bullish trend. However, my bias for the week ahead is counter the prevailing trend. Price did close the first time below a higher low. This catches my attention. This is not a shift of trend yet.
USD vs CHF
Bullish bias for the week.
 |
| USD vs CHF W1 |
This is the weekly chart of USD vs CHF. Price formed a Bullish Engulfing Pattern at a level of interest. See to the left, you'll see a break of a lower high. Price did pull back to this level and formed a bullish reversal pattern. This puts my bias in favour of the bulls. Additionally, the USDOLLAR Index (FXCM USD Index) also suggests bullishness. Basically below parity I would rather maintain a neutral of negative biase, but market structure suggests bullishness.
EUR vs GBP
Mixed signal.
 |
| EUR vs GBP W1 |
This is the weekly chart of EUR vs GBP. I was debating with myself whether or not to list this asset. As you can tell, I decided in favour of the latter. Price is in a narrow trading range, which I like to call a congestion zone. It is not advised to trade inside the congestion. However, I like how last the week Rejection Candle formed right on top of support. This suggests strength at this level. A close below the lower red horizontal line would negate this putative strength.
AUD vs CAD
Bullish bias for the week.
 |
| AUD vs CAD W1 |
This is the weekly chart of AUD vs CAD. This is an asset that likes to wick a lot. So keep this in mind trading AUD vs CAD. Price shows resistance to move south. Last week did close as a Rejection Candle. Price tried to violate the swing low but failed to do so. This puts my bias in favour of the bulls.
It seems the week ahead will be an interesting one. USD appears to be the srongest asset for the week ahead. Many trading opportunities do not necessarily mean to take many trades. I hope you find my weekly analysis useful in your journey as a trader.
If you have any questions or feedback please leave them in the comments section below.
Happy trading,
TT


Keine Kommentare:
Kommentar veröffentlichen