Mixed signal.
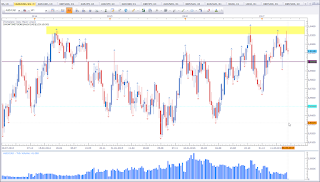
This is EUR vs USD weekly timefame. With the break of the previous high, we do have all signs for a bullish trend within a big range marked with the black dotteted line. We have successive higher lows and a higher highs. Price was not able to violate 1,10. Based on market structure, we should see a test of 1,15 sooner or later. At this level, we may see some ranging. As long price stays above the previous high I am bullish. The bias is neutral below 1,10. To avoid confustion, I will get interested in bullish setups as price approaches the support level (the recently broken high) and ignore short setups.
AUD vs CAD
Mixed signal.
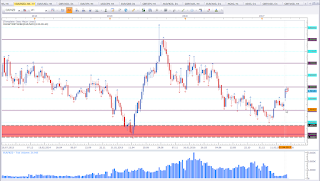
This is AUD vs CAD weekly chart. as mentioned the previous week, price did run to the yellow zone (see here). Price did run to the resistance level and bounced off it. We have a confirmed Hanging Man at a top and a two candle reversal pattern (Bearish Engulfing Pattern). Market structure suggests rather bearishness as price was not able to violate the resistance zone and bounced off rather strongly. Price was not able to form a new high (not even by a signle pip). As long price stays between the yellow zone and the parity level. Price may try a second attempt to break resistance. As long price has not violated the previous low, the current bullish trend is valid. I am neutral above 1 and below the yellow zone. Only as price approaches one of these levels will I get interested in this asset.
EUR vs NZD
Mixed signal.
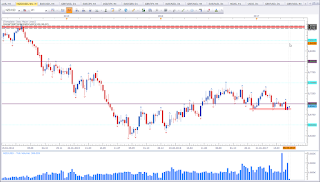
This is EUR vs NZD weekly chart. Last week did close as a Doji at 1,60. This level has been support and resistance in the past. We have a bullish pair. Price did run strongly north since the first half of March. The trend is bullish. But we may see a pullback starting at this level. I'll keep an eye on this asset.
GBP vs USD
Mixed signal.
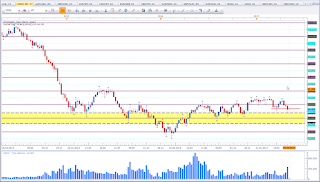
This is GBP vs USD weekly chart. Simmilar to EUR vs USD we have a structure shift. Price is making successiv higher lows and broke a previous high. Last week candle looks like a Hanging Man. A Hanging Man formation is a bearish reversal pattern. But this pattern needs confirmation. A close below the body will cofirm the pattern and would signal a short setup. Currently the lower wick can signal both, a rejection of lower prices or signal bearishness. The level is interesting as we may see a pullback from this level. I do not have clear signals to establish a clear bias but see a good chance for a retracement.
NZD vs USD
Mixed signal.
This is NZD vs USD weekly chart. Price is was not able to violate the support level. I talked about this level last week (here). Currently I am neutral to bearish this asset. As long price is below 1,70 I am rather bearish. Only a close above the previous bearish candle will make me reevaluate. But as long price is not able to violate the support level, I am neutral. What may happen this week is, a test of 1,70 and the break of support. But we don't know yet. Time and price will tell.
AUD vs USD
Bearish bias for the week.
This is AUD vs USD weekly chart. Price did close below 0,75. This puts my bias in favour of the bears. But I do not really like how the candle closed. But what I see is a violation of a previous low and a close below 0,75. This puts my bias in favour of the bears. We may see a test of resistance (previous low) though. A close above last week candle high will neutralise the bearish bias.
USD vs CAD
Mixed signal.
This is USD vs CAD weekly chart. This pair did catch my attention after quite some time. Price was finally able to violate resistance (yellow zone). This is bullish. However, we have a pinbar with nothing really to the left. This is a strong signal. This may signal that we did have a fake break. But price is still above support (former resistance in yellow). It is very worth to keep an eye on this pair. I will treat this asset very cautiously this week. Maybe with the weekly close we'll get a clear signal.
US Oil
Mixed signal.
This is US Oil weekly chart. Price did violate support (red line). But the violation is not really a strong violation. At the same time price is rejecting support (yellow zone). We may see a bounce and higher Oil prices from here. The 45 level is key. Either we see a break or a confirmation of this level.
Happy trading,
TT


Keine Kommentare:
Kommentar veröffentlichen